Market leading insight for tax experts
View online issue

The changing composition of UK tax revenues

printer Mail
Speed read

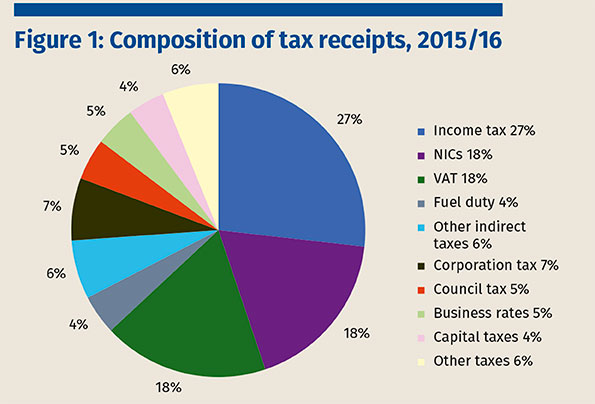
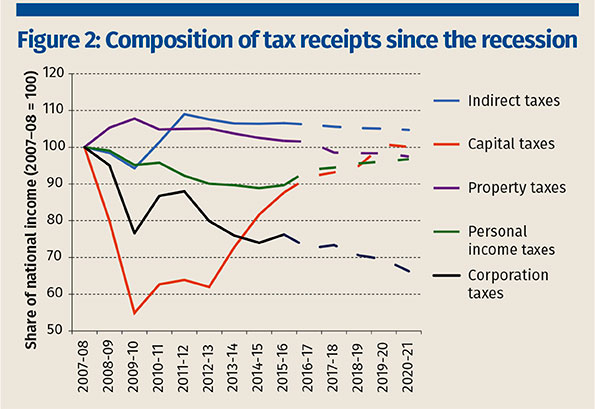
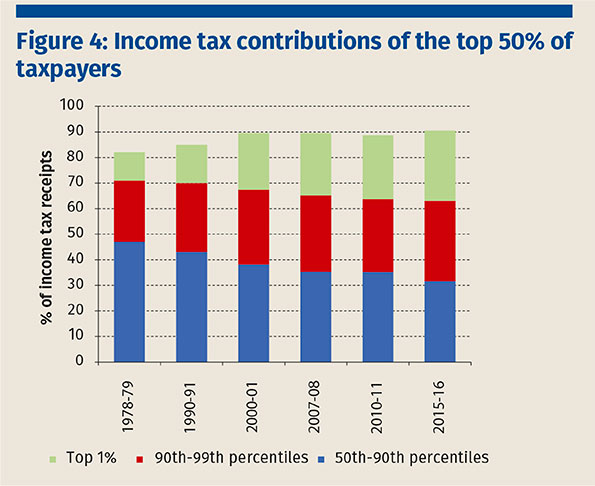
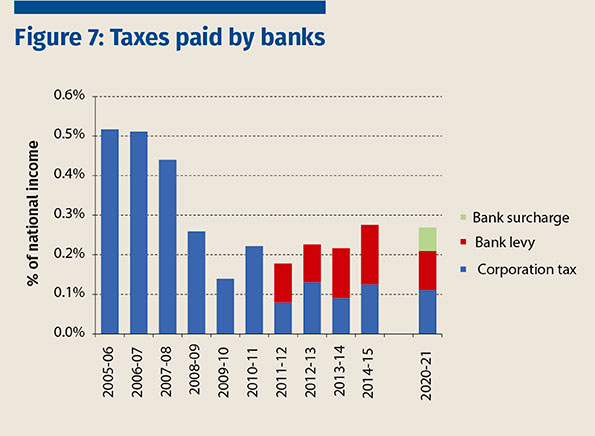
By the end of the parliament, tax receipts are due to return to their pre-recession share of national income. However, compared with 2007/08, policy choices mean the taxman looks set to raise more from VAT and less from other indirect taxes; about the same amount from personal income taxes, though with more of that coming from the highest earners; less from the main property taxes; and substantially less from corporation tax. HM Treasury will be more reliant on small taxes, including five entirely new ones. Whether these changes have been part of a clear and coherent overarching strategy is, to put it kindly, unclear. 

The great recession, which officially lasted from December 2007 to June 2009, triggered the two largest annual falls in real government receipts since at least 1956. By the end of the current decade, UK tax receipts are due to be 37.2% of national income, almost back to their pre-recession level. But despite this return to an apparent stability in the overall tax take, there have been significant shifts in the composition of tax revenues.
 
The UK currently raises around 45% of receipts from income tax and NICs, 28% from VAT and other indirect taxes, 5% each from the two main taxes on property, 7% from corporation taxes, and 10% on capital and other taxes (figure 1).
 
 
Compared to the start of the recession, VAT receipts have been boosted by the 2012 increase in the rate to 20%, while revenues from other indirect taxes have fallen, largely due to the political choice to consistently freeze fuel duty at 2011 levels (figure 2). In recent times, business rates (levied on the rental value of commercial property) have provided a stable source of revenue because they do not, by default, fluctuate with corporate incomes. Yet policy change means that revenues will now increase less quickly than previously planned. Some properties with low rental values will be taken out of business rates all together. Business rates and council tax are the only two taxes that, to at least some degree, provide a source of revenues to local authorities, something that will become more important under increased tax devolution across England.
 
 
Receipts from personal income and capital taxes have been depressed by weak wages and capital returns respectively; however, they are forecast to recover to around their pre-recession levels (as a fraction of national income) by 2020/21. The lack of growth of these revenues between 2007/08 and 2020/21 contrasts with the trend in the decade or so before the recession, which saw revenues from income and capital taxes increasing in importance (figure 3). The stability of personal income taxes also marks a large shift in the composition of taxpayers. 


The rich contributing more

 
Between 2007/08 and 2015/16, there has been a fall in the share of the adult population who pay income tax (from 65.7% to 56.2%); and, for the remaining taxpayers, there has been an increase in the proportion of income tax paid by the top 1% (from 24.4% to 27.5%).
 
This fits with a much longer term trend towards a lower proportion of income tax payments from the bottom 50%, and higher payments from the top 1% of income taxpayers. In 1978/79, the top 1% of taxpayers paid only 11% of income tax receipts. This had more than doubled by the turn of the century (see figure 4). 
 
 
The trend pre-2007 was overwhelmingly driven by the distribution of pre-tax income: top incomes increased faster than median incomes and inequality increased considerably, such that the larger burden on richer taxpayers mostly reflected their higher share of total incomes. The post-2007 trend has resulted largely from explicit policy choice. Notably, substantial increases in the personal allowance have worked to take many low earners out of income tax, while also reducing payments for lower to middle taxpayers. At the same time, cuts to the higher rate threshold help to explain an increase in the number of higher rate (and additional rate) taxpayers from 3.9m in 2007/08 to 5.0m in 2015/16. Meanwhile, those on incomes above £100,000 now see their personal allowance gradually withdrawn, and those earning over £150,000 have faced a higher tax rate and less generous pension tax relief.
 
It seems unlikely that this trend will unwind substantially over the next five years. Following the Conservative party election manifesto pledge, the personal allowance is expected to increase further, to £12,500 by 2020/21, and thereby take more individuals out of income tax. A pledge to increase the higher rate threshold to £50,000 should hold constant the number of higher rate taxpayers, but the income tax thresholds applying to the highest earners are expected to affect more people because they are fixed in cash terms.
 
One implication of an income tax base that increasingly relies on a smaller group of taxpayers is that tax revenues become more sensitive to the composition of income growth, making revenues more uncertain. This includes both upside and downside risk. If the earnings of the top 1% or 10% grow more quickly than the rest of the distribution, tax revenues may increase more quickly than total earnings. In the last parliament, total earnings growth was driven more by employment growth than by average earnings growth. Previous IFS analysis calculated that the employment-heavy composition of total earnings growth cost the exchequer £6.5bn in income tax receipts between 2010 and 2015.
 

Banking on a strong recovery to offset lower corporation tax rates? 

 
A notable feature of figure 2 is that revenues from corporation taxes have declined substantially as a proportion of national income and are forecast to fall further over the next five years. 
 
A small part of the decline can be attributed to North Sea receipts, which represented only 0.5% of national income prior to the crisis and were already falling as reserves dried up. They have collapsed since 2011 along with the world oil price, leading to continuous downgrades to revenue forecasts (figure 5). The North Sea tax regime is actually forecast to cost the exchequer money in 2018/19, as weak profitability combines with reliefs for decommissioning costs. These tax revenues are unlikely to form a substantial part of the UK tax base in future.
 
 
The main story is a fall in onshore corporation tax receipts. By the end of the parliament, these are forecast to be 26% lower as a proportion of national income than before the crisis. This substantial change results largely from the combined effects of a sharp fall in financial sector profits and a £10.8bn a year policy giveaway.
 
Corporation tax always moves with the economic cycle. Since 2008, receipts have been depressed by a combination of weak corporate profits and the effect of losses that were accumulated in the wake of the recession and then carried forward to offset future tax liabilities. The finance sector has seen the largest fall. The sector accounted for around a quarter of onshore corporation tax receipts before the crisis but contributes just 15.2% today. The fall has been driven predominantly by the banking sector (figure 6).


In response to the lower revenue stream coming from banks and, in part, in response to the view that banks should contribute to the public finance cost of the crisis, the government has restricted the share of banks’ taxable profit that can be offset by carrying forward losses. It has also introduced two new taxes. 
 
Restricting loss offsets works to bring forward government revenues. It also disadvantages companies (as they now have to pay corporate taxes sooner and, if they go out of business, will be unable to claim all of their loss relief). The bank levy (introduced in 2011) and an 8 percentage point surcharge on banks’ corporation tax rate (introduced in 2016) will both buoy the amount of tax paid by banks (figure 7), but neither are underpinned by a clear strategy. Notably, the bank levy rate was almost constantly ratcheted up to increase the revenue take, before abruptly changing course in 2015 in response to concerns about its effect on banks’ decisions. The rate will now be reduced in each year of this parliament. 


More thought should be given as to whether, and if so how, the banking sector should be taxed differently from other sectors. More broadly, the set of new taxes, which also include a diverted profits tax, an apprenticeship levy and a sugar levy, have tended to be introduced hastily and without consideration of the full set of effects.
 
Policy changes, of which there have been many, also help to explain lower onshore corporation tax receipts. We calculate that, taken together, policies announced between 2010 and Budget 2016 (including those that are due to come into place before the end of the parliament) cost £10.8bn a year in 2015/16 terms. The majority of the revenue cost is due to tax rate cuts. The coalition government reduced both the main corporation tax rate (from 28% in 2010) and the small profits rate (from 21% in 2010) to 20%; and introduced a new lower 10% rate for the income derived from patents (the patent box). The corporation tax rate will fall to 17% by 2020/21, a cut that is almost twice as expensive as previous main rate cuts because it now applies to all companies, not just large ones. 
 
These moves have been explicitly motivated by the desire to attract and retain mobile activity and to give the UK the lowest corporation tax rate in the G20. Moves to broaden the base and crack down on avoidance – including the diverted profits tax and forthcoming restrictions on interest deductions by multinational companies – and new taxes on banks have not been sufficient to outweigh the cost of rate cuts.
The overall trajectory of corporation tax receipts will continue to depend on the strength of growth in corporate profits, and especially on the recovery of a few very large banks that drive receipts in the formerly tax-rich financial sector. If onshore revenues remain permanently lower, this will mark a break with the trend in the last 30 years or so. Despite the main corporation tax rate being cut from 52% in 1981 to 28% in 2008, receipts held up as a result of a larger and more profitable corporate sector – and, to some extent, a broadening of the tax base. At present, it remains uncertain whether, and to what extent, the financial sector and the associated tax base will bounce back or whether it will remain permanently smaller than before the crisis.
 

Still no long term strategy in sight 

 
By the end of the parliament, policy change will have led to a substantial change in the composition of tax revenues. A source of concern is the extent to which some policy changes are being made in an ad hoc fashion with insufficient attention paid to tax design. Such ad hocery ranges from continued unfulfilled promises to raise fuel duty in line with inflation to the introduction of the diverted profits tax, encompassing ever-shifting taxes on banks and constant fiddling with a growing set of small taxes. New taxes have tended to be hastily introduced without consideration of the full set of effects. The lack of apparent and communicated strategy matters and is reflected in an increasingly complex tax system. 
 
There is always uncertainty around forecast tax receipts. The risks to revenue streams are currently larger than usual: there is still uncertainty about the strength of the recovery, it is difficult to forecast the receipts from new taxes and there is policy risk in the sense that the government may choose to deviate from the assumptions embedded in forecasts. A long term strategy for the tax system would help to alleviate some of these risks.  
 
This article draws on an IFS report by the same authors, The changing composition of UK tax revenues, IFS Briefing Note BN182, which contains further details and from which all the figures in this article are taken.
 
EDITOR'S PICKstar
Top